Pixel Carpet
An interactive visualization for log files that enables forensic detection of anomalies.
The Pixel Carpet originated in a research paper in collaboration with computer security engineers of various institutions. The main focus was the discovery of anomalies in network log data.
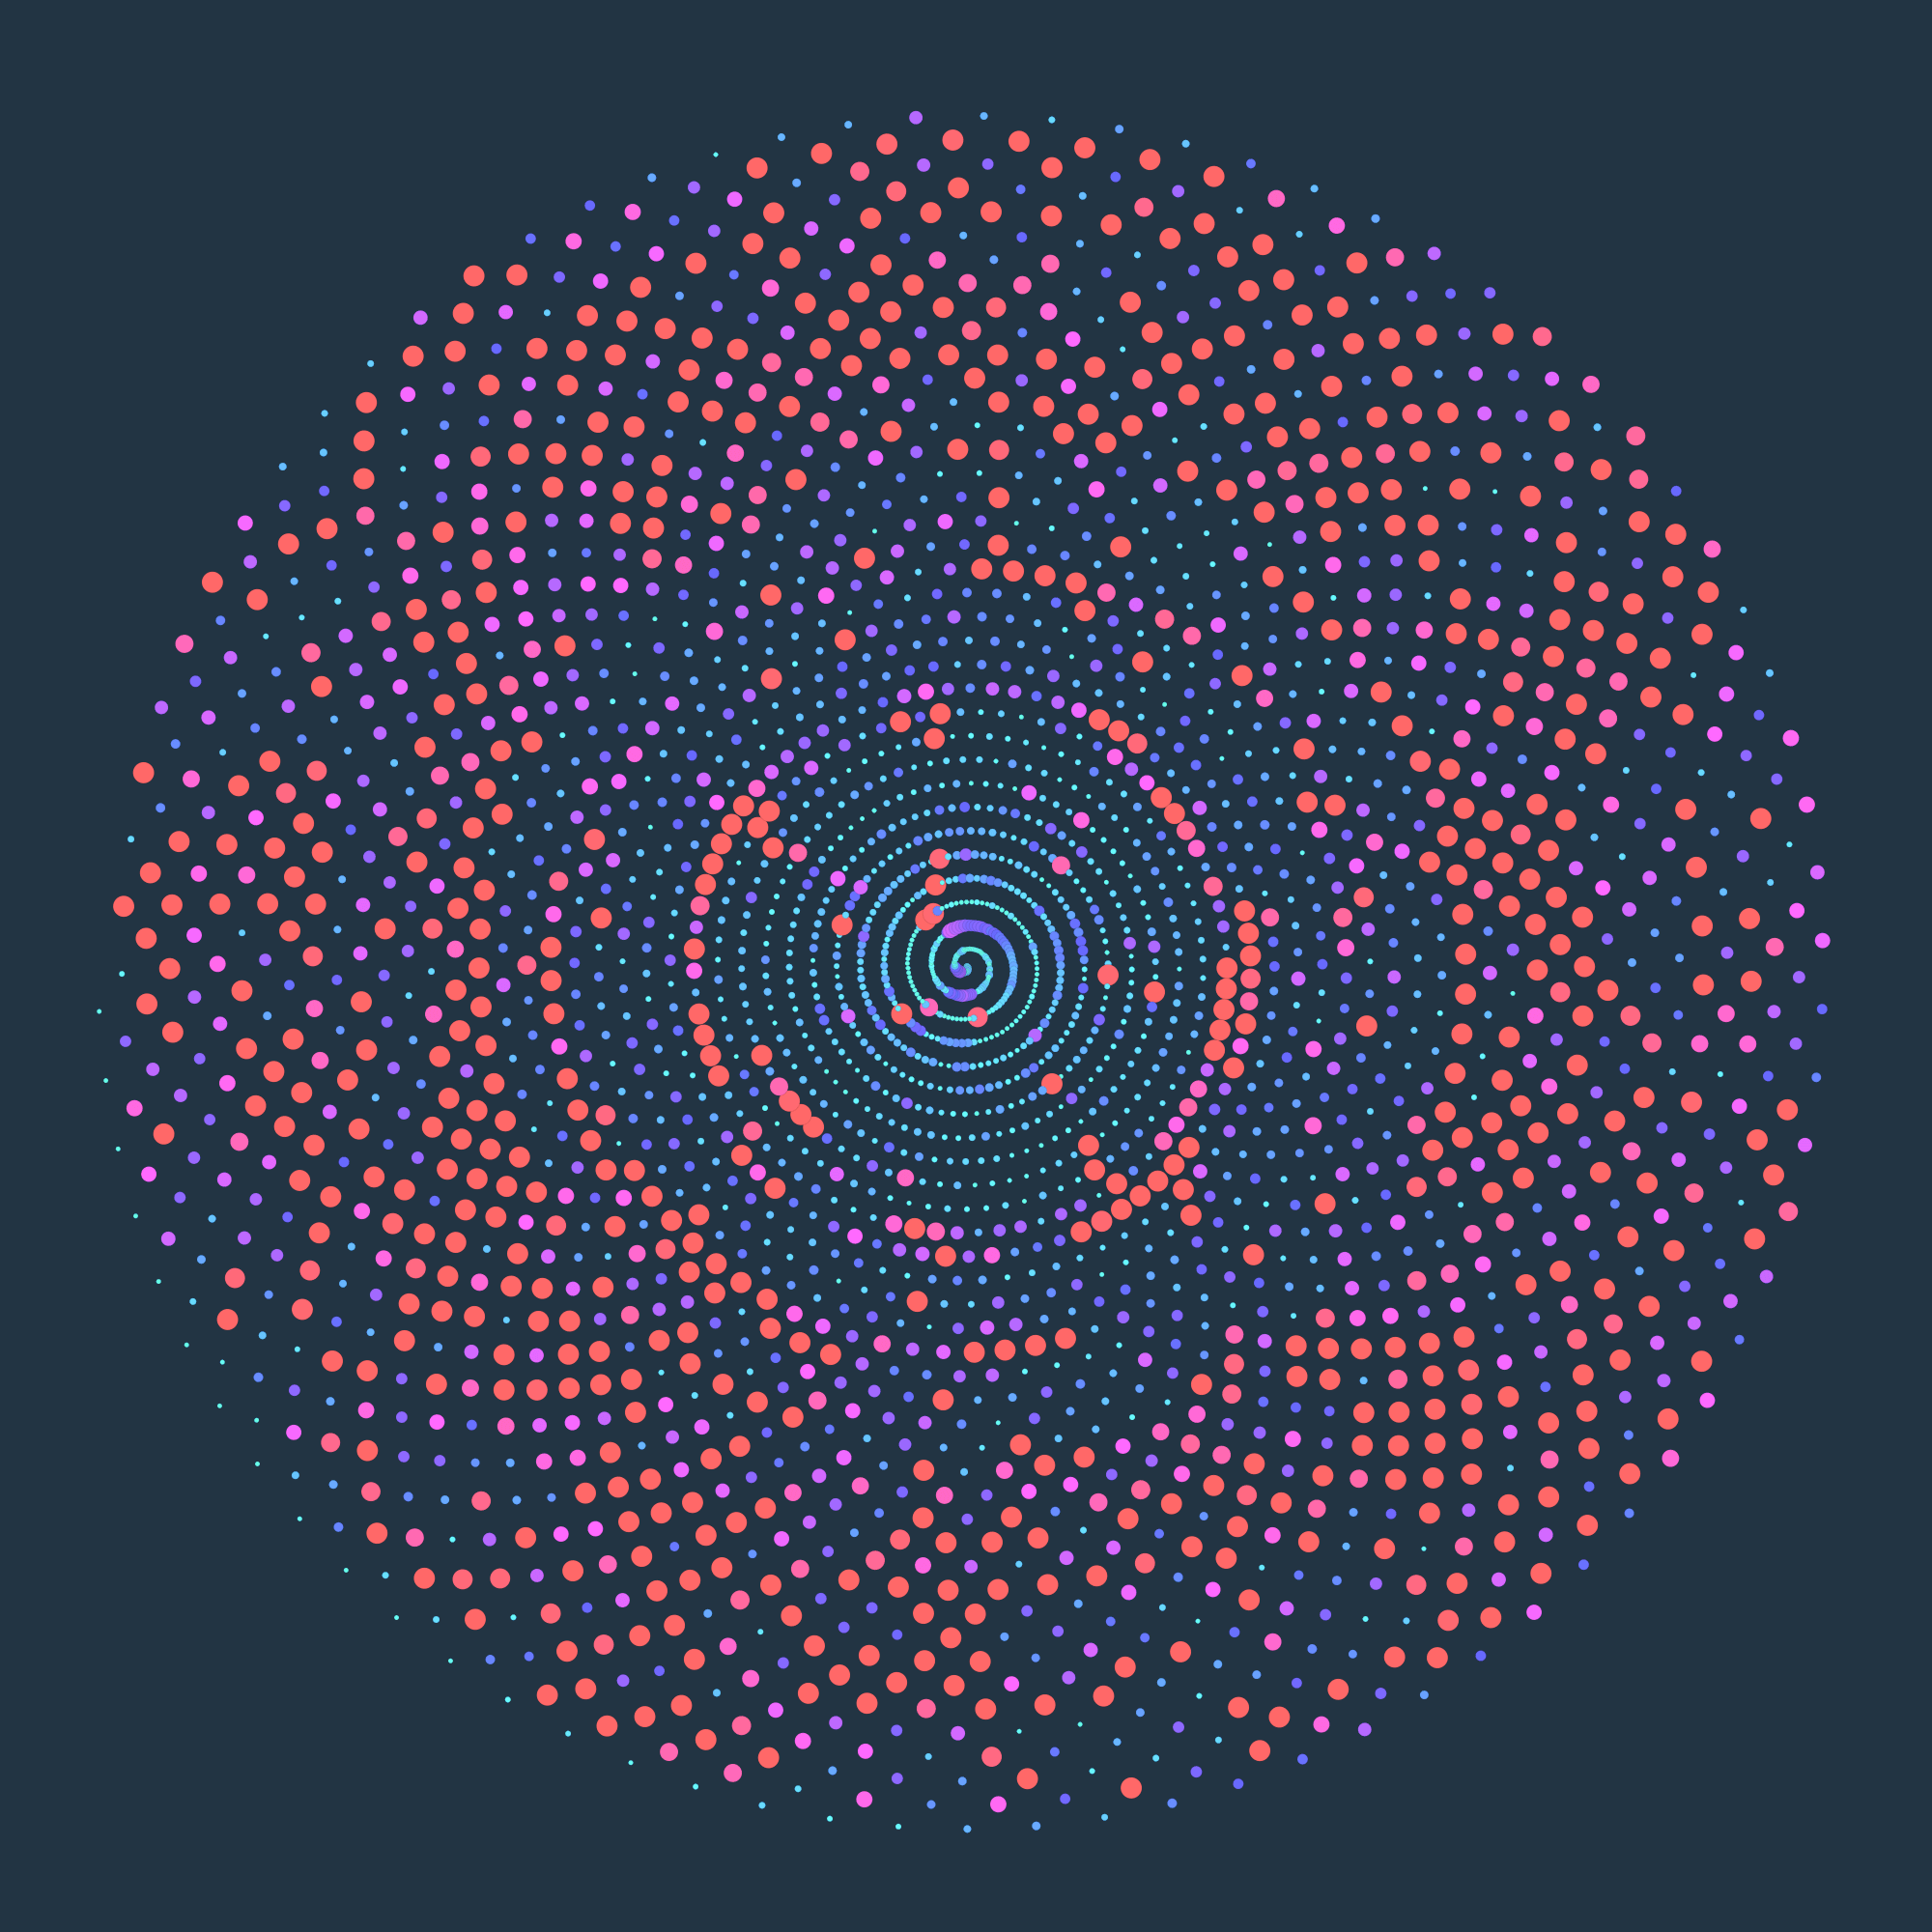
Lines of a log file are presented as pixel columns. The color depends on the frequency in the data set, where red pixels are rare and blue pixels are the standard. Holding the mouse over a pixel highlights similar log entries depending on the comparison settings. Log entries can be removed by clicking on the corresponding pixel and by using a filter form in the controls.
Paper
The paper about the Pixel Carpet was accepted and presented at IEEE VIS 2014 in Paris. It contains the results and learning from the co-creative approach of jointly developing visualizations with computer security engineers. More information, including the downloadable paper, can be found at complexdatavisualized.com.
The Prototype
To bring the ideas to life we built a prototype with HTML, CSS and JavaScript. The early transition from the idea to a prototype gave an opportunity to quickly experiment with the visualization creating many variations with small-detail changes. After many iterations and consultations with security experts the final prototype was built.
We put the prototype online, though it does not perform very well.