VISMind

A tool that allows researchers to create models of complex societal decision-making through an easy-to-use drag-and-drop user interface.
VISMind is based on InnoMind, an agent-based model that utilises theories of emotional cognition from cognitive science. The tool is organised into three main levels: Agent Overview, Agent Details and Scenario Settings.
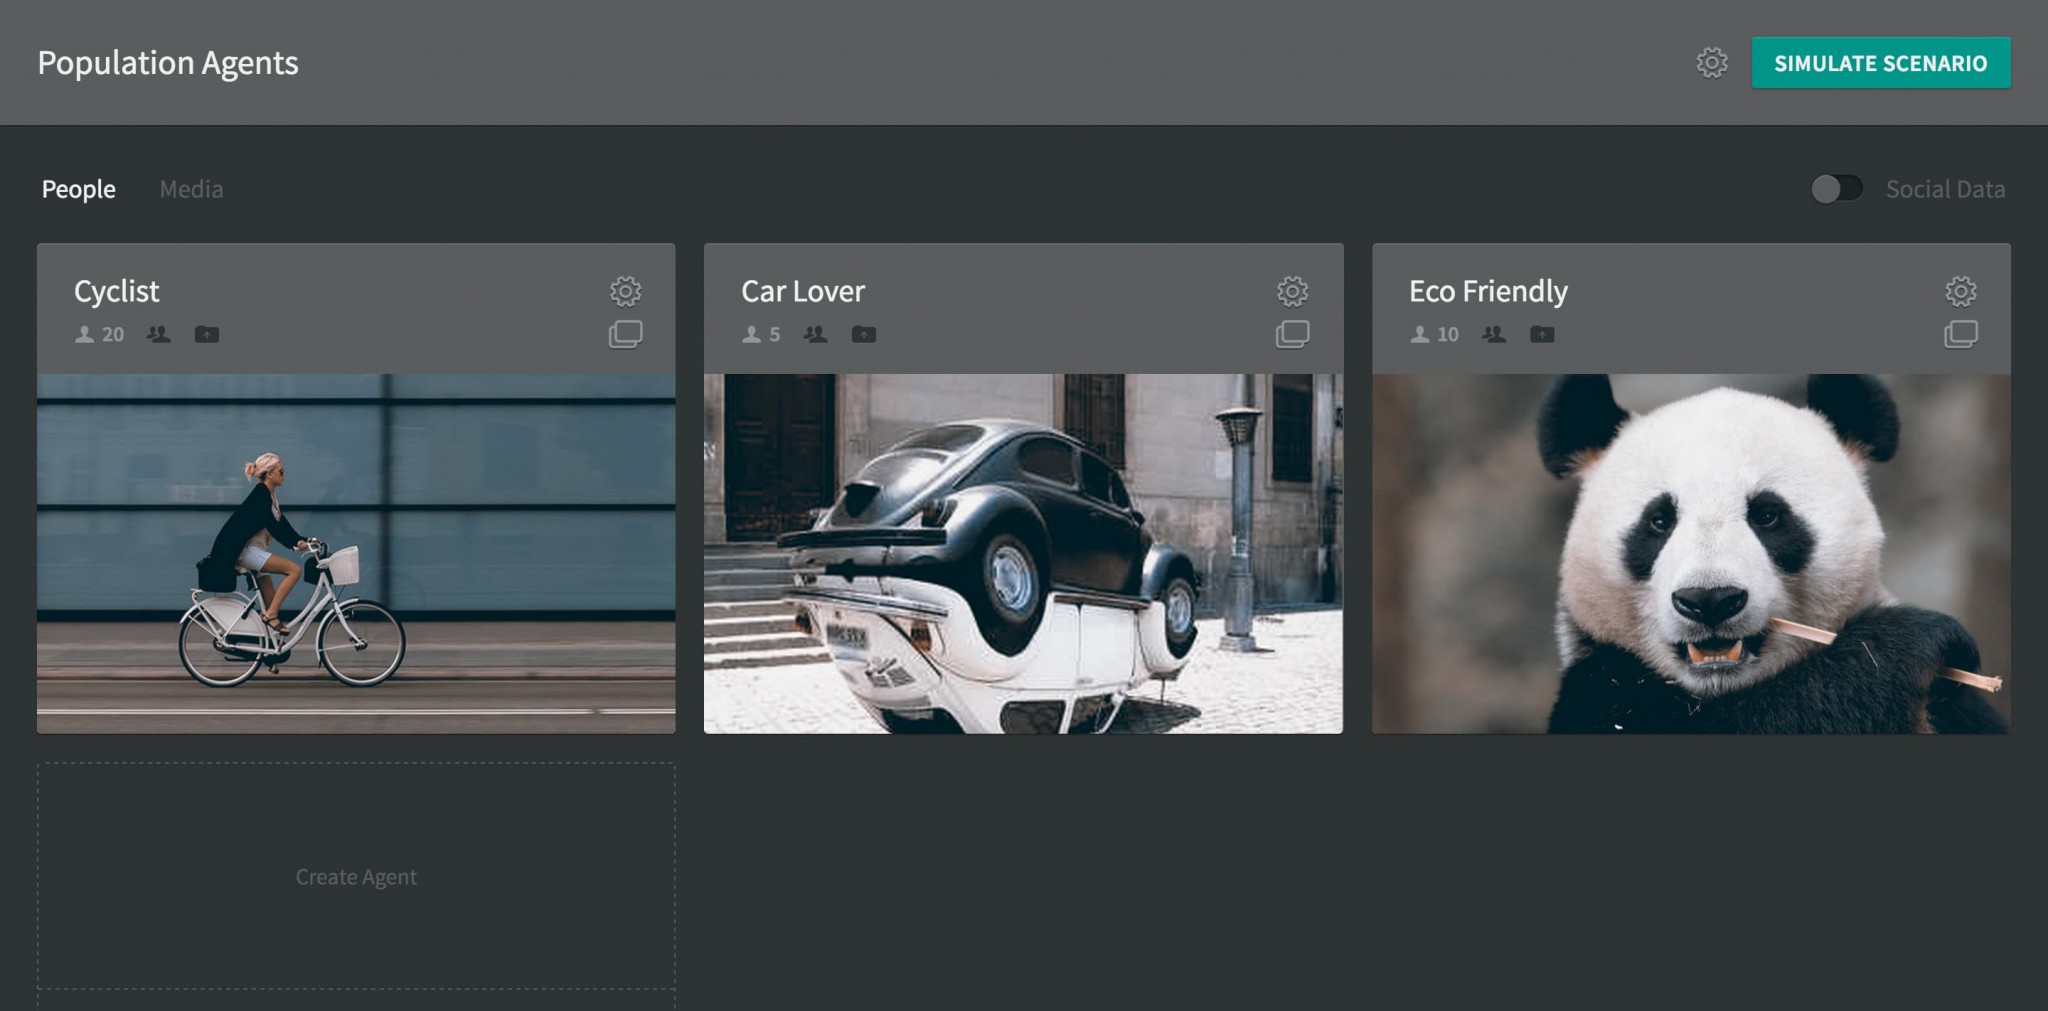
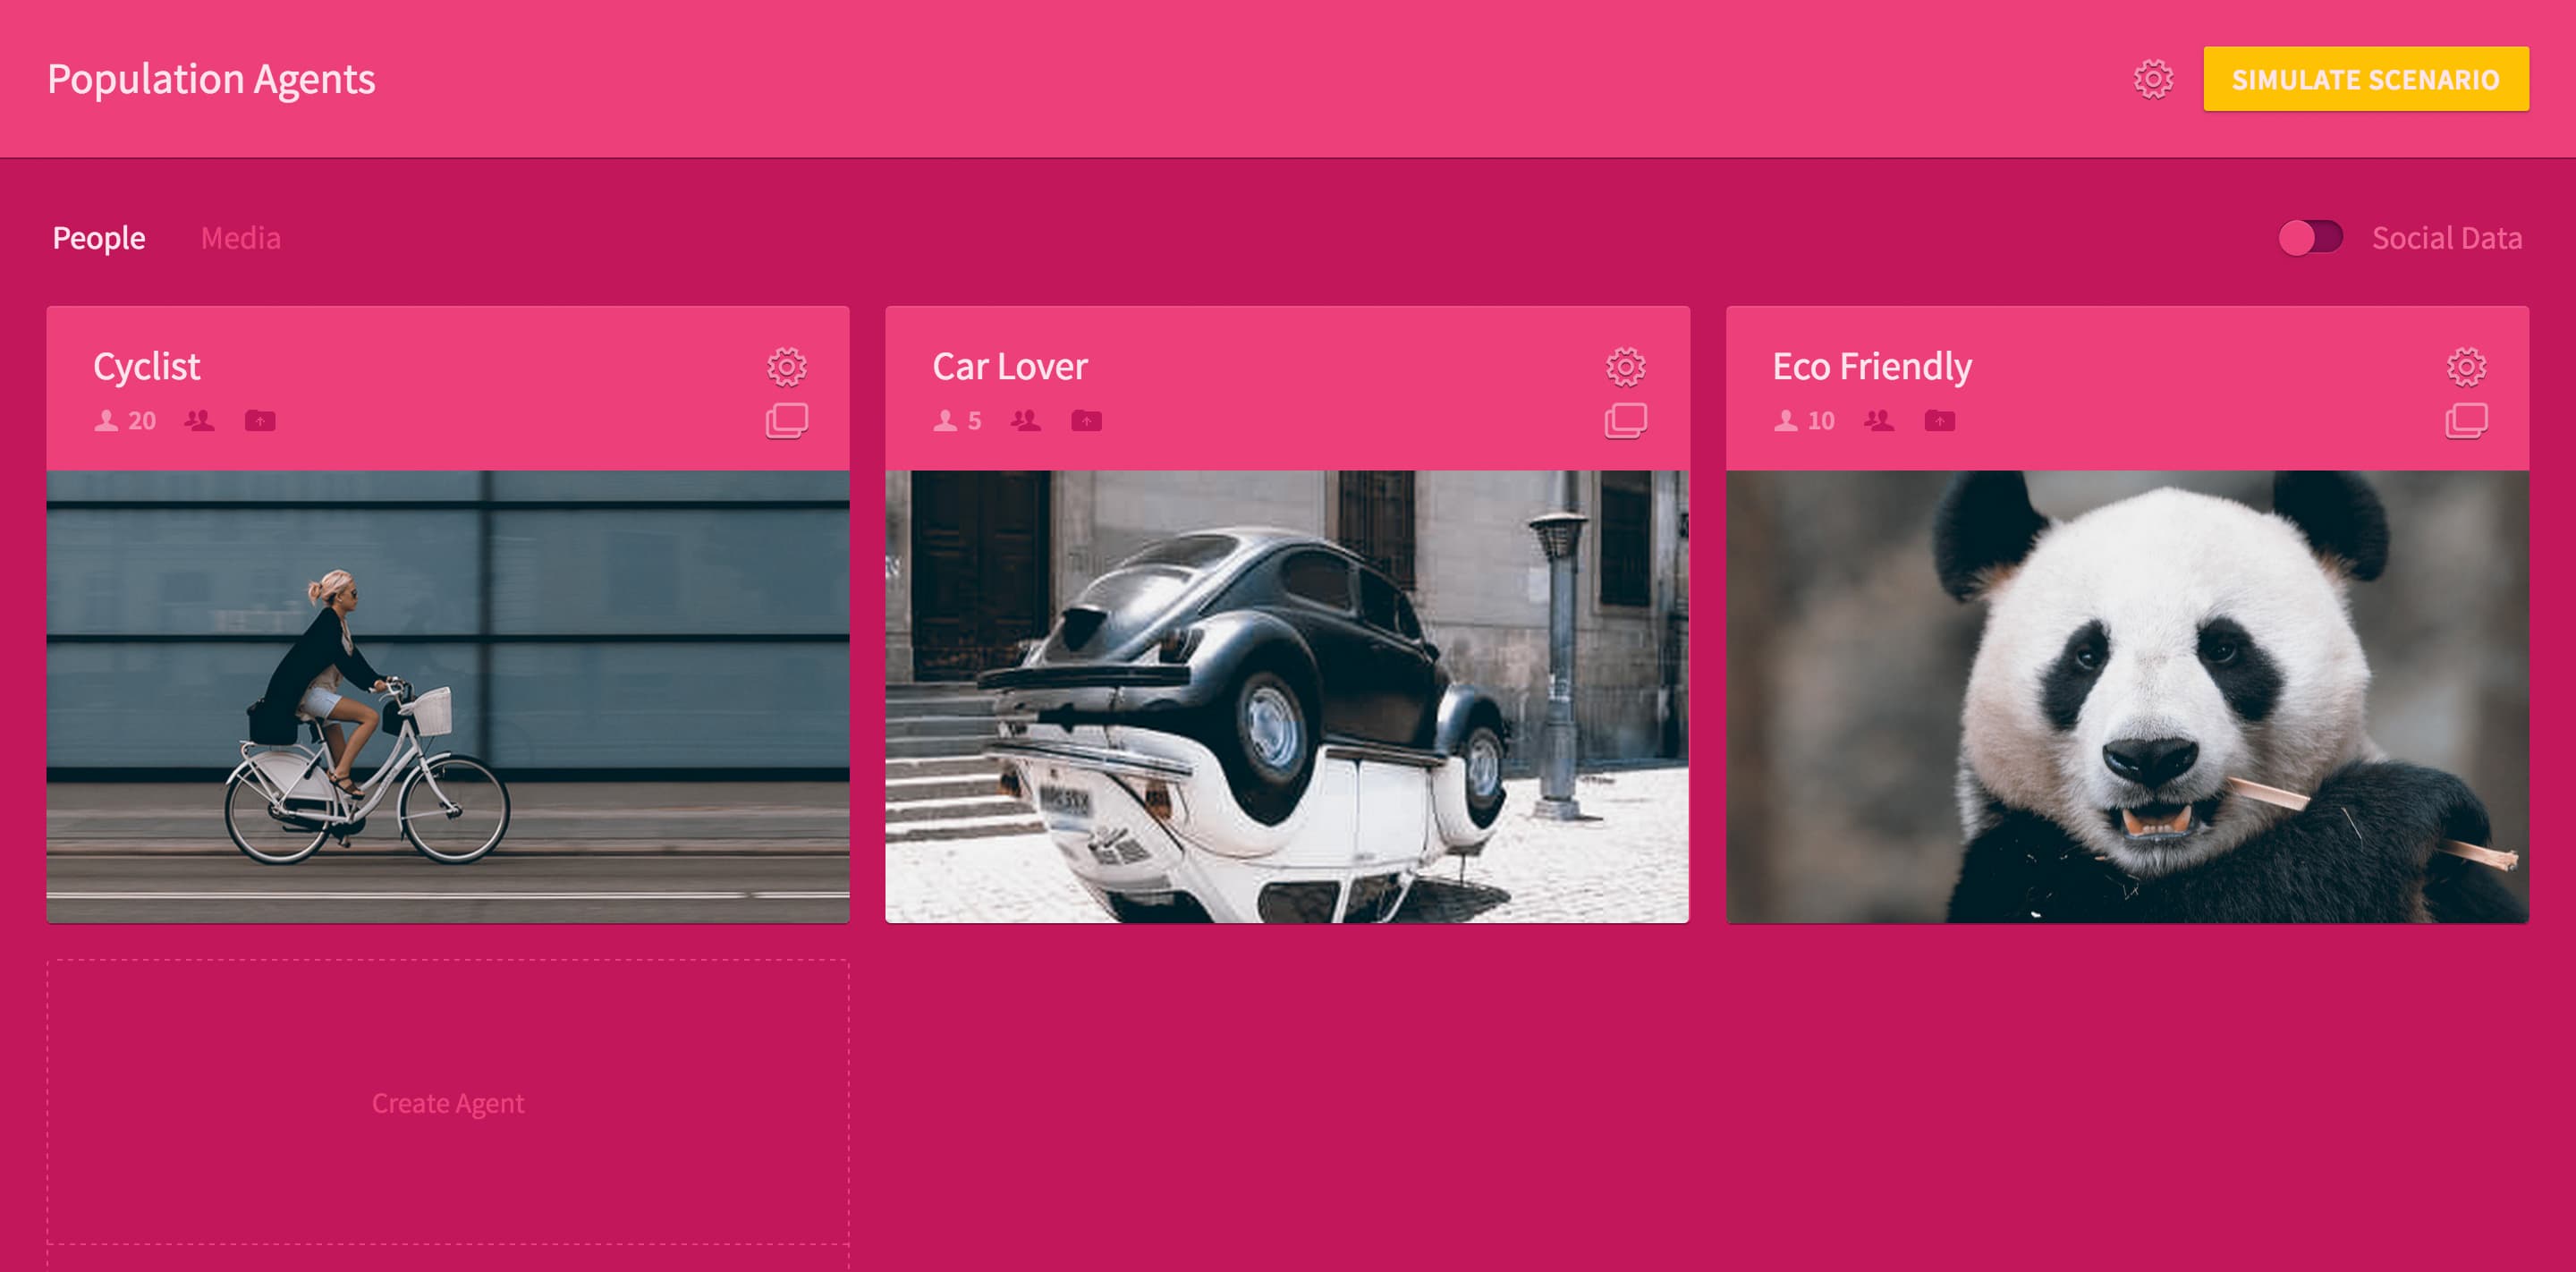
Agent Overview
Basically, this is a dashboard where agents can be created and edited. An agent represents a stereotype and includes a node structure, with needs and options for action that are important for the simulation. Each agent attracts a unique name and a number value relating to the amount of creations in the simulation.
For fast recognition and to support each agent’s profile, an image can be assigned. We discussed the use of images, because we thought that most users are not particularly motivated to search for matching pictures. But the main use for this version of the tool is likely to be presentation by a trained researcher, who definitely would wish to choose an image.
To add even more detail to an agent, socio-demographic data can be uploaded. Agents can be imported, duplicated, exported and deleted. However, the most important thing is the node architecture of the agent this can be created in the next step—the Agent Details.
Agent Details
The Agent Details view is divided into two tabs—editing and connecting nodes. First, you need to create nodes. Here, each node is assigned a title, valence and priority value.
Once created, a node arranges itself in a curved grid, which we call the “Curved Magneto Grid”. We decided to use a curve so that no line run on top of an other in the subsequent network visualization. If the nodes were arranged on a horizontal line, the connections would overlap and thus no longer be recognizable.

The color depends on the valance value of the node, and the size determines the priority. Changing the appearance of the node directly allows fast evaluation.

The next step is the definition of the connections between nodes. To avoid visual confusion, the focus is on a distinct but understandable separation of the individual steps. When changing a tab, the nodes are still arranged in the same grid, which has the advantage that the nodes retain their positions. This sounds simple, but it is important to retain the orientation.
In contrast to the visual representation, the functionality changes in the connections tab. Now, clicking on a node is centring it, while the other nodes are arranged around it, in a radial layout. The connections can be defined by dragging inactive nodes closer to the focused node. This strong reference to proximity clarifies the type of the connections—the closer a node is, the stronger the connection.

Focusing nodes in order allows a stepwise definition of the connections and, the principle of proximity visually illustrates the relationship of nodes to each other.
If no node is focused, a classic network visualization layout, mixed with the Curved Magnetic Grid, is represented. This classic view is known to the target user group and helps its members to understand the connections quickly. Moving the mouse over a node highlights its connections.
Scenario Settings
In the Scenario Settings, values can be entered and changed for the subsequent simulation. Researchers should have to touch any code, so all expert settings can be edited in the GUI too.
Skins and Styles
The style is based on the previous version of the tool. Anyways for the choice of colorscheme, we have developed a system based on depth that makes it easy to change this, with just eight SASS variables. Here are some extreme examples: